
Design. Monitor. Optimise.
Heat pump schemes are funded on promised performance, but few organisations hold independent evidence that the systems are delivering the efficiency, comfort and carbon savings they were funded to deliver. Jupiter Performance measures what the plant is actually doing.
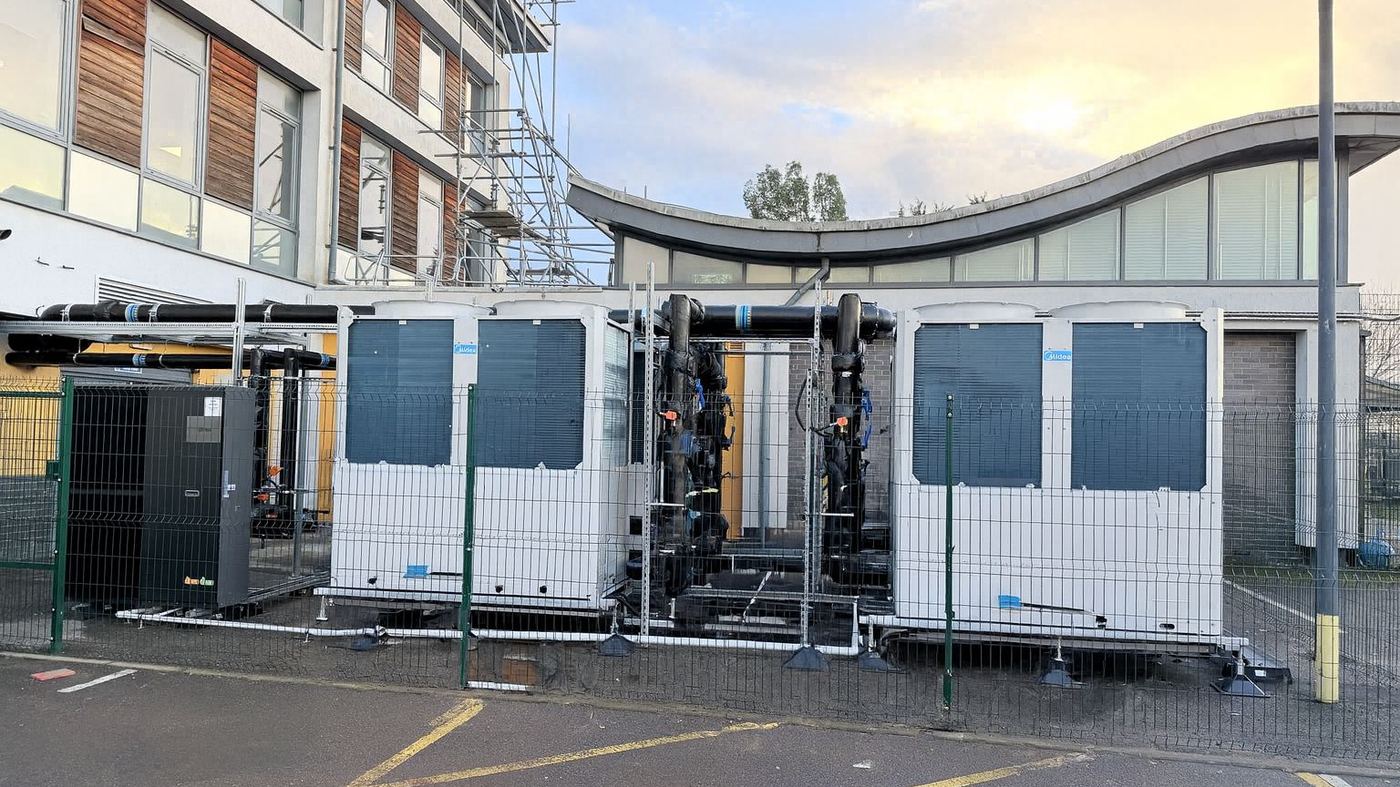
Measured against design
A week from a live monitored site, measured against the efficiency the funding application was awarded on.
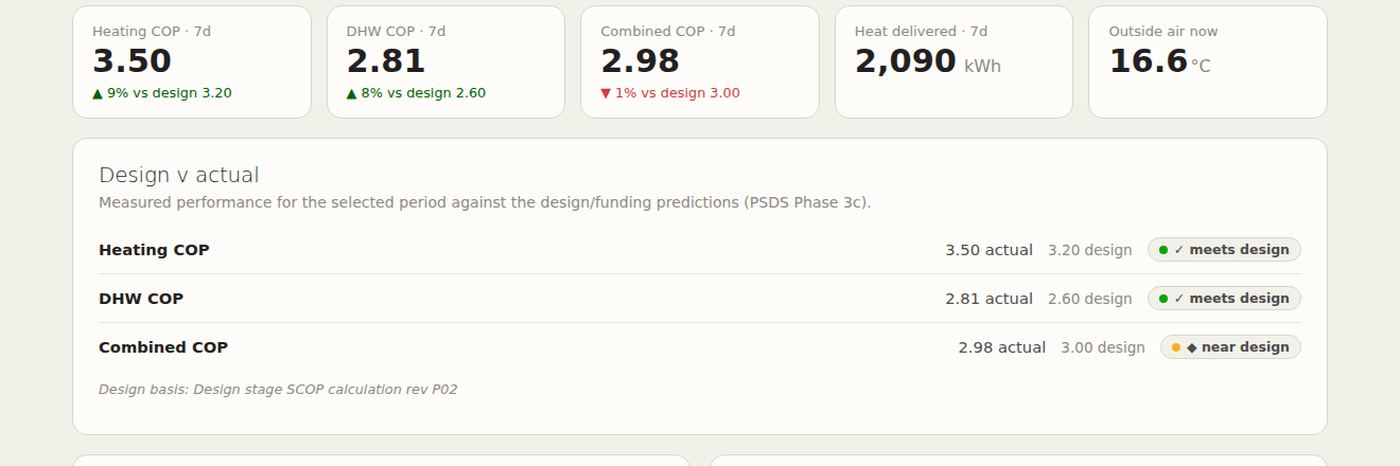 Measured against design. Client name withheld pending consent.
Heating is 9% above the design prediction and hot water 8% above. Combined sits 1% below, and the dashboard reports it that way. Evidence is only useful if it also records the misses.
This is the same scheme type we cover under heat pump design, and the reason our case studies carry measured rather than modelled figures.
A BMS controls plant. It is not designed to prove outcomes.
Jupiter Performance connects to what you already have, such as Trend, Tridium and meter data, and measures independently what the system is doing. It is vendor-neutral and installer-neutral.
A decarbonisation scheme is not successful because a heat pump has been installed. It is successful when the building is comfortable, the plant is reliable, and the carbon and cost savings arrive.
How the system behaves, not just what it used
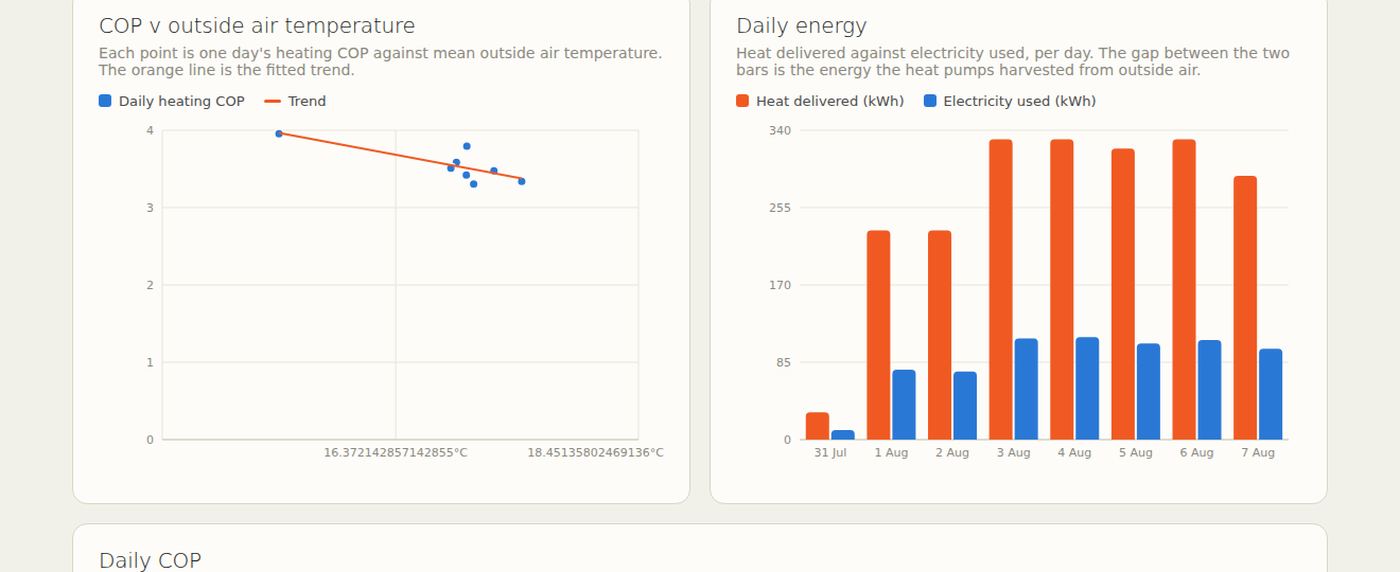
Two charts do most of the work. Coefficient of performance against outside air temperature shows how the system responds as the weather turns — a heat pump that falls away steeply in cold weather is telling you something about its flow temperatures. Daily heat delivered against electricity used shows the gap between the two, which is the energy the plant harvested from outside air rather than paid for.
What it does
Measures real efficiency
Heating, hot water and combined coefficient of performance, calculated from heat and electrical metering over any period you choose.
Compares to design
Every headline figure sits next to the design or funding prediction it was awarded on, with a plain verdict: meets design, near design, or below.
Checks its own data
Every monitored point carries a last-seen timestamp and a live status. A performance figure built on a dead sensor is worse than no figure at all.
Finds the money
Flow temperatures set higher than necessary, plant running out of hours, backup boilers and immersion heaters doing the work, short cycling, sequencing failures.
Writes the findings
Automatic checks each period produce findings and recommended actions in plain language — and an engineer reviews them before they reach you.
Stays neutral
Vendor-neutral and installer-neutral. No commercial interest in the answer, which is what makes the evidence worth anything.
Connect, monitor, identify, compare, improve, evidence
A small on-site device connects to the existing network and BMS over BACnet/IP. Installation takes a few hours. Existing Trend, Tridium and similar platforms are read as they are, along with heat meters and electrical sub-meters. Nothing is replaced.
A typical school maps around 40 points. From those we calculate what the plant is actually delivering, and report it monthly or quarterly with an engineer's review rather than an automated summary.
Setup, then subscription. A one-off setup covers the device, BMS integration, point mapping, dashboard build and commissioning verification. Monitoring, reporting and engineering review then run monthly. Priced against your site.
What we look for, and usually find
- Flow temperatures set higher than necessary
- Heat pumps running outside occupied hours
- Backup boilers or immersion heaters operating too often
- Poor sequencing between heat pumps and existing plant
- Low temperature difference across heating circuits
- Incorrect sensors, meters or control signals
- Poor commissioning or controls integration
- Plant running when there is little or no building demand
- Performance drifting away from design intent over time
Send us the scope
A building, a stage, a date. We will come back with whether we can take it, what it costs and what we would need from you — usually within a working day.
Your questions, answered
What is Jupiter Performance?
Jupiter Performance is Jupiter Engineering's independent monitoring service for heat-pump-led projects. It calculates real coefficient of performance from heat and electrical metering, sets it against the design and funding predictions, tracks availability and faults, and reports what the plant is actually delivering. It is live on site today.
What does it actually measure?
Heating COP, hot water COP and combined COP over a chosen period; heat delivered in kWh against electricity used; COP against outside air temperature, so you can see how the system behaves as the weather changes; buffer and circuit temperatures; and the freshness of every monitored point feeding those figures. Each headline number is shown against its design value with a plain verdict — meets design, near design, or below.
Is it a separate company?
No — same company, same engineers. It came out of our design work: we kept commissioning carefully designed plant with no way to confirm how it ran afterwards. Measured data now shapes how we design the next scheme, and design knowledge tells us what is worth measuring.
Do you only monitor systems you designed?
No. The service is vendor-neutral and installer-neutral and works on systems designed and installed by others. Independence is the point — evidence from the party that installed the plant is worth less than evidence from someone with no stake in the answer.
What hardware is needed?
A small on-site device connected to the existing network and BMS. Installation typically takes a few hours. There is no requirement to replace an existing BMS or controls platform.
Which systems does it connect to?
Existing BMS platforms over BACnet/IP, including Trend and Tridium, plus heat meters, electricity meters and sub-metering. A typical school maps around 40 points: outside air temperature, flow and return per heat pump, buffer and hot water temperatures, circuit temperatures, electrical sub-meters, thermal energy meters and status and fault signals.
Can you calculate a real seasonal efficiency without heat metering?
No, and we will say so. An efficiency figure calculated without heat metering in the right place is an estimate and should not be presented to a funder or a board as anything else. Where metering is missing or badly placed we tell you at survey what needs adding.
What does it cost?
A one-off setup covering the edge device and router, BMS integration, point mapping, dashboard build, commissioning verification and handover; then a monthly subscription for the monitoring, reporting and engineering review. Both are priced against the site — building size, system complexity, number of points and how much reporting you want. Ask and we will quote.
What if the monitoring shows the system is underperforming?
Then you have found out while something can still be done. Most of what we find — flow temperatures set too high, plant running outside occupied hours, backup boilers or immersion heaters doing the work, poor sequencing, controls left in commissioning defaults — is correctable without capital works.